
Monitoring & Alerts
Gain end-to-end observability for your virtual machines and network. Track the performance of your resources and proactively identify problems.
Transform your business with modern monitoring tools
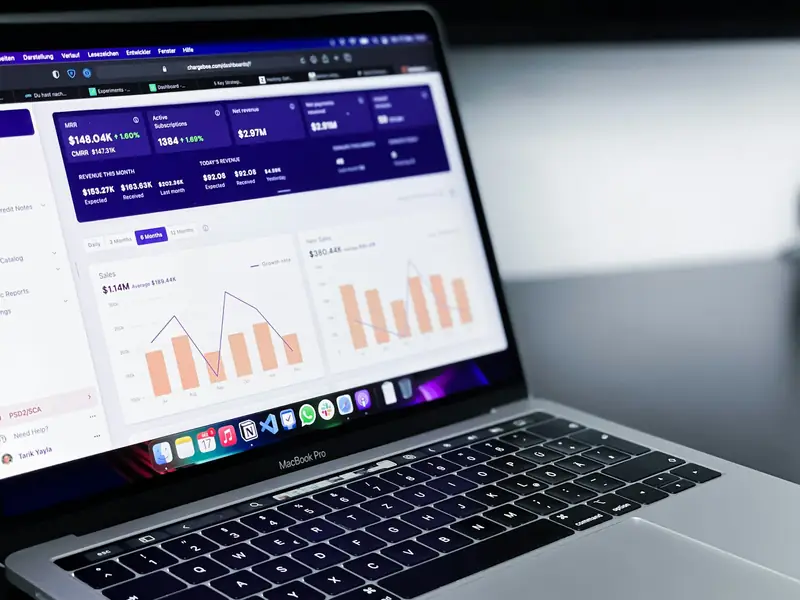
Monitor without agents
Get fast onboarding and a single standard: metrics are read from the infrastructure layer and the monitoring screens sit inside your cloud portal.

Troubleshoot efficiently
Enhance diagnostics with an event timeline that lines up metric, alert, network flow, audit and cost events in one time window.
Integrate with your own systems
Send alerts by webhook to your own incident management system or to your team chat channel.

Enable enterprise readiness
Elevate privacy and security for mission-critical workloads with organisation isolation, an audit log and monitoring data that stays in data centres in Türkiye.
Example scenarios

A team that hears before a disk fills up
An alarm fires when the disk threshold is crossed; the rule is evaluated on the server every 60 seconds, whether or not anyone has the screen open. The alert lands in the team’s chat channel through a webhook.

An admin tracking down a slowdown
Metric, alarm, network flow and audit events line up in one time window. The change made just before the slowdown shows on the timeline.

A security team seeing which country traffic goes to
Network flow analysis shows who talks to whom, on which port and protocol, and which country the traffic goes to. No extra software is installed on the virtual machines.
Boost performance with simplified monitoring tools
Ready-made summary
Get a single health verdict, a risk score and four summary cards for your organisation with minimal configuration.
Visualisation tools
Observe CPU, memory, disk usage and network traffic for your virtual machines on charts, over ranges of 15 minutes up to 30 days.
Network flow analysis
See who talks to whom, on which port and protocol, whether the connection was allowed and which country the traffic goes to.
Critical situation response
Get alerts when a CPU, memory or disk threshold is crossed; rules are evaluated server-side every 60 seconds, even when nobody has the screen open.
Duration-based alert rules
An alert fires only if the breach lasts for the duration you set, and a resolved record is written when it ends.
Capacity and backup status
See quota usage, how many more virtual machines fit in your quota and whether each virtual machine meets its RPO target, in one place.
Embedded security
Organisation isolation
The organisation is taken from the authenticated session; each organisation sees only its own data, and alert rules are evaluated only against its own virtual machines.
Failed sign-in warning
Failed sign-in attempts in the last 7 days are flagged as a warning on the audit screen.
Honest data source status
If a data source cannot be reached, the screen does not show an empty or healthy view; it says plainly that the source is temporarily unreachable.
Monitoring & Alerts pricing
Pricing is set by quote for your environment, and each price item is listed separately in the quote.

Learn more to get started
Managed Support
Explore managed support options for continuous monitoring of your platforms and incident response.
Enterprise IT
Discover solutions for IT teams moving business applications to the cloud.
Software-Defined Data Center
Learn about the architecture that brings servers, storage and networking into one platform.
Infrastructure
Find out about the data centres and infrastructure the services run on.